---
title: "Technical Overview"
document_id: sobe-2025-main-ai
document_type: report_section
parent_document: ../report.md
section_id: main-section-04-technical-overview
section_order: 4
section_count: 17
language: en
license: CC-BY-4.0
---
# Technical Overview
> Selective-retrieval section 4 of 17 from the [complete AI-readable report](../report.md). Content is copied without editorial summarization; relative asset, data, and code paths are rebased for this directory.
- **Parent document:** [`report.md`](../report.md)
- **Section ID:** `main-section-04-technical-overview`
- **Order:** 4 of 17
- **Words:** 7778
- **Previous:** [Executive Materials](03-executive-materials.md)
- **Next:** [Part I: Foundations](05-part-i-foundations.md)
This Technical Overview gives a compact, data focused map of the rest of the report. While the Executive Summary presents the main conclusions at a high level, this section summarizes, for each major technical chapter, the key quantitative facts, scaling relationships, and bottlenecks that define the current state of brain emulation. Readers who want a single, technically informed snapshot of where the field stands, before diving into the detailed chapters, should be able to find it here.
## Organism Scale Overview
The magnitude of the emulation challenge scales non-linearly with organism complexity. The following table summarizes the physical dimensions and component counts for the five primary model organisms discussed in this report.
Table 1 Physical dimensions and component counts for the five model organisms
| Organism | Developmental Stage | Approx. Brain Volume | Neuron Count | Synapse Count |
|---|---|---|---|---|
| C. elegans | Adult | 0.002 mm³ | ~300 | ~5,600 (chemical)
~600 (gap junctions) |
| Larval Zebrafish | ~5-7 days post fertilization (dpf) | 0.08 mm³ | ~1 x 10⁵ | (Not yet fully quantified) |
| Drosophila | Adult | 0.04 mm³ | ~1.4 x 10⁵ | ~5 x 10⁷ |
| Mouse | Adult | 420 - 460 mm³ | ~7 x 10⁷ | (not fully quantified; for scanned cubic millimeters ~5 x 10⁸ per mm³ ) |
| Human | Adult | 1,000,000 - 1,500,000 mm³ | ~8.6 x 10¹⁰ | (not quantified) |
## Recording brain activity - Neural dynamics
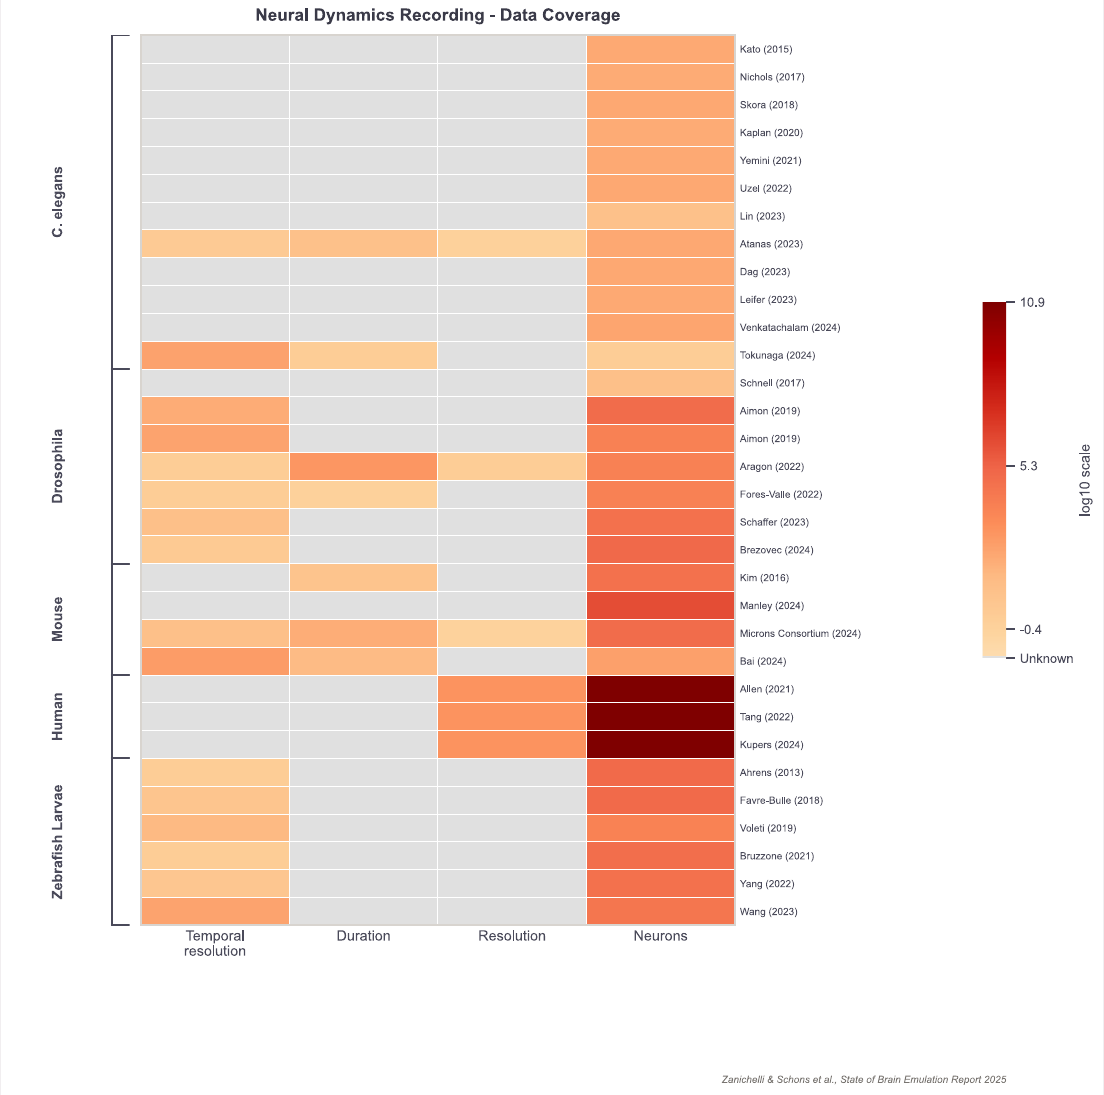
Despite impressive progress in neuron recording capabilities, neuroscience has not yet achieved whole-brain recording (≥ 95% of neurons and brain volume) at single-neuron resolution in any organism. The closest achievements include larval zebrafish with approximately 80% brain coverage and C. elegans with roughly 50% of nervous system neurons recorded at single-cell resolution. Even these figures, however, come with substantial limitations: temporal resolution is typically well below neuronal firing rates (often 1-30 Hz for calcium imaging), recording durations remain short (minutes to hours), and the need for head-fixation severely constrains behavior repertoires. In larger organisms like mice, recordings focus on cortical regions or specific brain areas rather than whole-brain coverage, while human recordings are either non-invasive and thus not single-neuron resolution or restricted to clinical settings and sample from extremely localized volumes of hundreds of thousands of neurons.
Figure 1, an aggregation of all studies available for this report, visualizes these: smaller organisms have more data available and are more likely to have significant data without fixation. Also, recording duration in all organisms is at least 2-3 orders of magnitude away from the entire life span. Finally, recording modalities with strong performance in one dimension will likely have poor performance in another.
Current single-cell resolution neural activity recording methods fall into two broad categories, each with distinct trade-offs. Optical fluorescence microscopy approaches, primarily calcium imaging, excel at capturing activity from large populations of neurons simultaneously (up to approximately one million in mouse cortex or tens of thousands in zebrafish and Drosophila) but suffer from slow temporal resolution that misses individual spikes in many neuron types. Electrophysiological methods like Neuropixels offer millisecond-precision spike detection but sample sparsely, typically recording from hundreds to a few thousand neurons along electrode trajectories. Voltage imaging with genetically encoded voltage indicators is emerging as a potential bridge between these extremes, with recent demonstrations approaching tens of thousands of neurons at spike-relevant speeds in larval zebrafish, though this technology remains in active development and recording durations are limited.
A fundamental challenge is that these methods primarily track electrical activity. Monitoring the broader chemical context (neurotransmitters, neuropeptides, and other signaling molecules that critically shape circuit function) remains difficult. While genetically encoded neurotransmitter indicators have been developed for select molecules, they cover only a small fraction of the hundreds of neuromodulatory signals known to exist in these brains.
Obtaining comprehensive, single-neuron resolution recordings of whole mammalian brains faces severe physical constraints, and as a result will likely remain extremely challenging for the foreseeable future (see Figure 2). Single-cell recording capabilities are currently at about 1 million cells at 2 Hz (calcium
imaging), equivalent to 2x10⁶ bits per second. In the 1980s about 5 cells could be sampled at 200 Hz (electrophysiology), equivalent to 10³ bits per second. For context, recording a mouse brain at single-neuron resolution recordings at 200 Hz (sufficient to resolve individual spikes) would generate about 1.4 x 10⁹ bits/s, while doing the same for a whole human brain would generate about 1.7 x 10¹⁵ bits/s.
The path forward requires progress on several fronts. First, maturing voltage imaging to achieve spike-resolution whole-brain recordings in smaller organisms remains a primary goal, with extending recording durations being a particular challenge. Second, expanding behavioral freedom requires lighter microscopes, less invasive surgical preparations, and creative experimental setups that permit more natural movement patterns. Third, greater emphasis on causal rather than merely correlational data is needed to reduce the otherwise prohibitive data requirements. This means integrating large-scale recording with systematic perturbations experiments of neural activity, most likely using optogenetic approaches. Such experiments then measure the effectome, a quantitative map of causal influence between neurons and would ground computational models in measured functional interactions rather than inferred ones. Finally, developing molecular sensors for the broader range of neurotransmitters and neuropeptides present in these organisms will add the chemical dimension necessary to understand how circuit dynamics emerge.
Figure 1 - Heatmap plot of significant brain recording publications across different organisms. The figure plots the relative distance from the respective organism's maximum value in a set of recording dimensions for a given publication. All papers referenced in the report and other noteworthy papers are listed. ([data](https://docs.google.com/spreadsheets/d/14rglcvdX8Bl6oSWgNnnlOVM_Oot0dHjfFIRHU2Y-mC0/edit?gid=0#gid=0))
### Machine-readable figure record: `main-fig-01`
```yaml
id: main-fig-01
document_id: sobe-2025-main-ai
document_path: report.md
anchor: main-fig-01
canonical_url: https://brainemulation.mxschons.com/ai/report.md#main-fig-01
figure: "Recording-publication capabilities heatmap"
assets:
- "../assets/report/main-fig-01-final-pdf.png"
- "../assets/report/main-fig-01-export.png"
data_status: publication_raster_with_contextual_current_sources
data_sources:
- "../data/current-repository/recordings/neural-dynamics-references.tsv"
generator: ../code/run_all_figures.py
generator_function: generate_rec_heatmap
publication_export_members:
- "images/image51.png"
canonical_pdf_pages:
- 14
note: "The final PDF's four-dimension heatmap is primary. The secondary final-circulation export raster has five dimensions and a different transformation. The vendored TSV is contextual, not an asserted exact input snapshot."
```
#### Inline contextual data (not an exact publication input): recording studies
```tsv
First author Year Organism Fixated / moving Method Number of neurons Temporal resolution: Hz Duration single session min per Individual Duration total repeated sessions per individual min Resolution in µm isotropic
Lin 2023.0 C. elegans fixated Calcium 8.0
Atanas 2023.0 C. elegans moving Calcium 136.0 1.7 8.0 16.0 0.5
Kato 2015.0 C. elegans fixated Calcium 127.0
Nichols 2017.0 C. elegans fixated Calcium 108.0
Dag 2023.0 C. elegans fixated Calcium 143.0
Leifer 2023.0 C. elegans fixated Calcium 122.0
Skora 2018.0 C. elegans fixated Calcium 129.0
Uzel 2022.0 C. elegans fixated Calcium 138.0
Venkatachalam 2016.0 C. elegans moving Calcium 187.0
Kaplan 2020.0 C. elegans fixated Calcium 114.0
Tokunaga 2024.0 C. elegans fixated Voltage 1.0 250.0 1.0 1.0
Yemini 2021.0 C. elegans fixated Calcium 125.0
Schnell 2017.0 Drosophila fixated Calcium 10.0
Brezovec 2024.0 Drosophila fixated Calcium 95200.0 1.8
Schaffer 2023.0 Drosophila fixated Calcium 40600.0 10.0
Aimon 2019.0 Drosophila fixated Calcium 63000.0 100.0
Aimon 2019.0 Drosophila fixated Voltage 7500.0 200.0
Aragon 2022.0 Drosophila fixated Calcium 7500.0 1.0 720.0 720.0 1.0
Kupers 2024.0 Human fixated fMRI 86000000000.0 12000.0 1000.0
Tang 2022.0 Human fixated fMRI 86000000000.0 960.0 1000.0
Allen 2021.0 Human fixated fMRI 86000000000.0 1000.0
Kim 2016.0 Mouse fixated Calcium 40000.0 5.0
Manley 2024.0 Mouse fixated Calcium 1000000.0
Microns Consortium 2024.0 Mouse fixated Calcium 75909.0 9.6 84.0 1120.0 0.4
Bai 2024.0 Mouse fixated Voltage 300.0 400.0 20.0
Favre-Bulle 2018.0 Zebrafish Larvae fixated Calcium 80000.0 4.0
Ahrens 2013.0 Zebrafish Larvae fixiated Calcium 80000.0 1.0
Voleti 2019.0 Zebrafish Larvae fixated Calcium 6000.0 25.75
Yang 2022.0 Zebrafish Larvae fixated Calcium 40000.0 3.3
Bruzzone 2021.0 Zebrafish Larvae fixated Calcium 52000.0 1.0
Wang 2023.0 Zebrafish Larvae fixated Voltage 25000.0 200.0
Fores-Valle 2022.0 Drosophila fixated Calcium 7500.0 1.0 0.5 900.0
```
#### Figure-generation source map (valid Python; not standalone plotting code)
```python
GENERATOR_PATH = "../code/run_all_figures.py"
SOURCE_FUNCTION = 'generate_rec_heatmap'
SELECTED_SOURCE_LINES = (
'neuro_rec_df = pd.read_csv(DATA_FILES["neural_dynamics"], sep=\'\\t\')',
)
```
Figure 2 - Estimated instantaneous information rate of neural recordings over time. Adaptation of [Urai et al., 2022](https://doi.org/10.1038/s41593-021-00980-9). This metric is defined as the number of simultaneously recorded neurons multiplied by their effective temporal resolution, capped at 200 Hz. This capped rate serves as a proxy for the instantaneous data bandwidth and provides a more consistent basis for comparison across different recording modalities. The 200 Hz cap balances the high-frequency capabilities of electrophysiology with the typical temporal dynamics of calcium imaging methods. Data points distinguish between Imaging (e.g., calcium imaging, light-sheet; blue circles) and Ephys (extracellular electrophysiology; red triangles), illustrating technological advancements. While this plot focuses on the simultaneous recording capacity, the total information acquired in an experiment also critically depends on the recording duration, a factor that varies widely and could be incorporated into future editions of this report. Horizontal dashed lines indicate theoretical maximum information rates for selected nervous systems (C. elegans body, fly brain, mouse cortex, whole mouse brain), calculated by multiplying their respective total neuron counts by the 200 Hz cap. These lines offer benchmarks for current experimental capabilities against the scale of these neural systems. ([data](https://docs.google.com/spreadsheets/d/1so1BojMiuSTadc6BvGAkQL-CM9ieRaUkmFYWh4iGmYc/edit?gid=157138621#gid=157138621))

### Machine-readable figure record: `main-fig-02`
```yaml
id: main-fig-02
document_id: sobe-2025-main-ai
document_path: report.md
anchor: main-fig-02
canonical_url: https://brainemulation.mxschons.com/ai/report.md#main-fig-02
figure: "Instantaneous neural recording information rate"
assets:
- "../assets/report/main-fig-02-final-pdf.png"
- "../assets/report/main-fig-02-export.png"
data_status: publication_raster_with_contextual_current_sources
data_sources:
- "../data/current-repository/recordings/neural-information-rate.tsv"
generator: ../code/run_all_figures.py
generator_function: generate_neuro_recordings
publication_export_members:
- "images/image15.png"
canonical_pdf_pages:
- 15
note: "The final PDF rendering is primary; the final-circulation export raster is retained as a secondary asset."
```
#### Inline contextual data (not an exact publication input): plotted rows
```tsv
Year Month Authors Method normalized_species effective_temporal_resolution_hz calculated_information_rate doi
2021.0 2.0 Demas et al. Imaging 2.0 2000000.0 https://doi.org/10.1101/2021.02.21.432164
2014.0 1.0 Maccione et al. Ephys 200.0 640000.0 https://doi.org/10.1113/jphysiol.2013.262840
2019.0 4.0 Stringer et al. Ephys 200.0 533600.0 https://doi.org/10.1101/306019
2017.0 3.0 Hilgen et al. Ephys 200.0 446800.0 https://doi.org/10.1016/j.celrep.2017.02.038
2019.0 11.0 Steinmetz et al. Ephys 200.0 353800.0 https://doi.org/10.1038/s41586-019-1787-x
2017.0 7.0 Pachitariu et al. Imaging 30.0 300000.0 https://doi.org/10.1101/061507
2019.0 10.0 Bartolo et al. Ephys 200.0 205200.0 https://doi.org/10.1371/journal.pcbi.1007514
2020.0 2.0 Bartolo et al. Ephys 200.0 165600.0 https://doi.org/10.1523/JNEUROSCI.2072-19.2019
2017.0 9.0 Mitz et al. Ephys 200.0 161400.0 https://doi.org/10.1016/j.jneumeth.2017.01.016
2018.0 11.0 Chen et al. Imaging 2.0 160000.0 https://doi.org/10.1016/j.neuron.2018.09.042
2020.0 7.0 Sahasrabuddhe et al. Ephys 200.0 158200.0 https://doi.org/10.1101/2020.07.17.209403
2009.0 10.0 Stafford et al. Ephys 200.0 148800.0 https://doi.org/10.1016/j.neuron.2009.09.021
2017.0 11.0 Jun et al. Ephys 200.0 148200.0 https://doi.org/10.1038/nature24636
2017.0 9.0 Cong et al. Imaging 1.6 128000.0 https://doi.org/10.7554/eLife.28158
2014.0 4.0 Schwarz et al. Ephys 200.0 113000.0 https://doi.org/10.1038/nmeth.2936
2013.0 11.0 Ifft et al. Ephys 200.0 99400.0 https://doi.org/10.1126/scitranslmed.3006159
2015.0 7.0 Shobe et al. Ephys 200.0 83600.0 https://doi.org/10.1152/jn.00464.2015
2018.0 4.0 Chung et al. Ephys 200.0 75000.0 https://doi.org/10.1101/242693
2009.0 3.0 Fitzsimmons et al. Ephys 200.0 66800.0 https://doi.org/10.3389/neuro.07.003.2009
2013.0 3.0 Ahrens et al. Imaging 0.8 64000.0 https://doi.org/10.1038/nmeth.2434
2014.0 8.0 Ito et al. Ephys 200.0 63000.0 https://doi.org/10.1371/journal.pone.0105324
2006.0 7.0 Lin et al. Ephys 200.0 52000.0 https://doi.org/10.1016/j.jneumeth.2005.12.032
2012.0 3.0 Bansal et al. Ephys 200.0 51400.0 https://doi.org/10.1152/jn.00781.2011
2003.0 7.0 Nicolelis et al. Ephys 200.0 49400.0 https://doi.org/10.1073/pnas.1934665100
2012.0 10.0 Marre et al. Ephys 200.0 45600.0 https://doi.org/10.1523/JNEUROSCI.0723-12.2012
2012.0 6.0 Churchland et al. Ephys 200.0 43600.0 https://doi.org/10.1038/nature11129
2011.0 11.0 O'Doherty et al. Ephys 200.0 40000.0 https://doi.org/10.1038/nature10489
2006.0 5.0 Kim et al. Ephys 200.0 38400.0 https://doi.org/10.1088/1741-2560/3/2/009
2004.0 6.0 Sanchez et al. Ephys 200.0 37000.0 https://doi.org/10.1109/TBME.2004.827061
2007.0 7.0 Zacksenhouse et al. Ephys 200.0 36600.0 https://doi.org/10.1371/journal.pone.0000619
2008.0 11.0 Kim et al. Ephys 200.0 35800.0 https://doi.org/10.1088/1741-2560/5/4/010
2005.0 5.0 Lebedev et al. Ephys 200.0 35400.0 https://doi.org/10.1523/JNEUROSCI.4088-04.2005
2019.0 4.0 Stringer et al. Imaging 3.0 33786.0 https://doi.org/10.1126/science.aav7893
2009.0 8.0 Dickey et al. Ephys 200.0 32200.0 https://doi.org/10.1152/jn.90920.2008
2011.0 3.0 Truccolo et al. Ephys 200.0 29800.0 https://doi.org/10.1038/nn.2782
1993.0 8.0 Wilson and McNaughton Ephys 200.0 29600.0 https://doi.org/10.1126/science.8351520
2005.0 7.0 Santucci et al. Ephys 200.0 29400.0 https://doi.org/10.1111/j.1460-9568.2005.04320.x
2004.0 3.0 Hatsopoulos et al. Ephys 200.0 28600.0 https://doi.org/10.1152/jn.01245.2003
2007.0 7.0 Hamed et al. Ephys 200.0 28000.0 https://doi.org/10.1152/jn.00760.2006
1998.0 11.0 Nicolelis et al. Ephys 200.0 27000.0 https://doi.org/10.1038/2855
2020.0 7.0 Ota et al. Imaging 1.56 24960.0 https://doi.org/10.1101/2020.07.14.201699
1996.0 2.0 Skaggs et al. Ephys 200.0 23400.0 https://doi.org/10.1002/(SICI)1098-1063(1996)6:2<149::AID-HIPO6>3.0.CO;2-K
2005.0 5.0 Blanche et al. Ephys 200.0 20000.0 https://doi.org/10.1152/jn.01023.2004
2000.0 11.0 Wessberg et al. Ephys 200.0 20000.0 https://doi.org/10.1038/35042582
1997.0 4.0 Nicolelis et al. Ephys 200.0 20000.0 https://doi.org/10.1016/S0896-6273(00)80295-0
2003.0 8.0 Csicsvari et al. Ephys 200.0 19200.0 https://doi.org/10.1152/jn.00116.2003
2004.0 10.0 Stein et al. Ephys 200.0 18000.0 https://doi.org/10.1113/jphysiol.2004.068668
2003.0 10.0 Carmena et al. Ephys 200.0 18000.0 https://doi.org/10.1371/journal.pbio.0000042
1991.0 5.0 Meister et al. Ephys 200.0 16400.0 https://doi.org/10.1126/science.2035024
2017.0 2.0 Song et al. Imaging 30.0 15330.0 https://doi.org/10.1038/nmeth.4226
2016.0 6.0 Sofroniew et al. Imaging 5.0 15000.0 https://doi.org/10.7554/eLife.14472
1994.0 7.0 Wilson and McNaughton Ephys 200.0 14800.0 https://doi.org/10.1126/science.8036517
2003.0 7.0 Harris et al. Ephys 200.0 13600.0 https://doi.org/10.1038/nature01834
1999.0 7.0 Normann et al. Ephys 200.0 13600.0 https://doi.org/10.1016/S0042-6989(99)00040-1
2002.0 6.0 Taylor et al. Ephys 200.0 12800.0 https://doi.org/10.1126/science.1070291
1999.0 12.0 Williams et al. Ephys 200.0 12400.0 https://doi.org/10.1016/S1385-299X(99)00034-3
1996.0 3.0 Skaggs et al. Ephys 200.0 11400.0 https://doi.org/10.1126/science.271.5257.1870
2000.0 1.0 Porada et al. Ephys 200.0 10400.0 https://doi.org/10.1016/S0165-0270(99)00139-9
1996.0 7.0 Nordhausen et al. Ephys 200.0 10200.0 https://doi.org/10.1016/0006-8993(96)00321-6
1995.0 6.0 Nicolelis et al. Ephys 200.0 9600.0 https://doi.org/10.1126/science.7761855
1999.0 7.0 Chapin et al. Ephys 200.0 9200.0 https://doi.org/10.1038/10223
2016.0 10.0 Prevedel et al. Imaging 3.0 9000.0 https://doi.org/10.1038/nmeth.4040
1998.0 9.0 Brown et al. Ephys 200.0 6800.0 https://doi.org/10.1523/JNEUROSCI.18-18-07411.1998
1997.0 4.0 Chang et al. Ephys 200.0 6400.0 https://doi.org/10.1016/S0006-8993(97)00012-7
1993.0 2.0 Shaw et al. Ephys 200.0 6000.0 https://doi.org/10.1080/01616412.1993.11740106
1996.0 12.0 McHugh et al. Ephys 200.0 5800.0 https://doi.org/10.1016/S0092-8674(00)81828-0
1988.0 8.0 Aiple and Kruger Ephys 200.0 5800.0 https://doi.org/10.1007/BF00248509
1996.0 1.0 Gothard et al. Ephys 200.0 4600.0 https://doi.org/10.1523/JNEUROSCI.16-02-00823.1996
1993.0 3.0 Nicolelis et al. Ephys 200.0 4600.0 https://doi.org/10.1073/pnas.90.6.2212
1988.0 7.0 Eckhorn et al. Ephys 200.0 3800.0 https://doi.org/10.1007/BF00202899
1985.0 7.0 Kuperstein and Eichenbaum Ephys 200.0 3800.0 https://doi.org/10.1016/0306-4522(85)90072-7
1981.0 1.0 Kruger and Bach Ephys 200.0 3600.0 https://doi.org/10.1007/BF00236609
1995.0 2.0 Vaadia et al. Ephys 200.0 3200.0 https://doi.org/10.1038/373515a0
1988.0 5.0 Espinosa and Gerstein Ephys 200.0 3000.0 https://doi.org/10.1016/0006-8993(88)91542-9
1989.0 6.0 Buzsaki et al. Ephys 200.0 2800.0 https://doi.org/10.1016/0165-0270(89)90038-1
1986.0 1.0 Kuperstein et al. Ephys 200.0 2800.0 https://doi.org/10.1007/BF00239532
1976.0 9.0 Schmidt et al. Ephys 200.0 2400.0 https://doi.org/10.1016/0014-4886(76)90220-X
1990.0 11.0 Ahissar and Vaadia Ephys 200.0 2200.0 https://doi.org/10.1073/pnas.87.22.8935
1991.0 1.0 Mountcastle et al. Ephys 200.0 2000.0 https://doi.org/10.1016/0165-0270(91)90140-U
1984.0 1.0 Kubie Ephys 200.0 2000.0 https://doi.org/10.1016/0031-9384(84)90080-5
1989.0 4.0 Lindsey et al. Ephys 200.0 1800.0 https://doi.org/10.1016/0006-8993(89)90183-2
1988.0 6.0 Mioche and Singer Ephys 200.0 1600.0 https://doi.org/10.1016/0165-0270(88)90131-8
1988.0 9.0 Drake et al. Ephys 200.0 1600.0 https://doi.org/10.1109/10.7273
1987.0 4.0 Lindsey et al. Ephys 200.0 1600.0 https://doi.org/10.1152/jn.1987.57.4.1101
1970.0 11.0 Humphrey, Schmidt, and Thompson Ephys 200.0 1600.0 https://doi.org/10.1126/science.170.3959.758
1985.0 4.0 Legendy and Salcman Ephys 200.0 1400.0 https://doi.org/10.1152/jn.1985.53.4.926
1982.0 6.0 Reitboeck and Werner Ephys 200.0 1400.0 https://doi.org/10.1007/BF01955338
1978.0 7.0 Durelli et al. Ephys 200.0 1400.0 https://doi.org/10.1016/0014-4886(78)90270-4
1983.0 8.0 Frostig et al. Ephys 200.0 1200.0 https://doi.org/10.1016/0006-8993(83)90567-X
1982.0 5.0 Kruger Ephys 200.0 1200.0 https://doi.org/10.1016/0165-0270(82)90035-8
1977.0 5.0 Abeles and Goldstein Ephys 200.0 1200.0 https://doi.org/10.1109/PROC.1977.10559
1983.0 6.0 Michalski et al. Ephys 200.0 1000.0 https://doi.org/10.1007/BF00236807
1982.0 12.0 Wheeler and Heetderks Ephys 200.0 1000.0 https://doi.org/10.1109/TBME.1982.324870
1981.0 3.0 Kuperstein and Whittington Ephys 200.0 1000.0 https://doi.org/10.1109/TBME.1981.324702
1975.0 7.0 Voronin et al. Ephys 200.0 1000.0 https://doi.org/10.1016/0006-8993(75)90324-8
1970.0 12.0 Humphrey Ephys 200.0 1000.0 https://doi.org/10.1016/0013-4694(70)90105-7
1976.0 9.0 Schmidt et al. Ephys 200.0 800.0 https://doi.org/10.1016/0014-4886(76)90217-X
1974.0 1.0 Dickson and Gerstein Ephys 200.0 600.0 https://doi.org/10.1152/jn.1974.37.6.1239
1972.0 1.0 Gerstein and Perkel Ephys 200.0 600.0 https://doi.org/10.1016/S0006-3495(72)86097-1
1970.0 9.0 Kristan and Gerstein Ephys 200.0 600.0 https://doi.org/10.1126/science.169.3952.1336
1964.0 3.0 Gerstein and Clark Ephys 200.0 600.0 https://doi.org/10.1126/science.143.3612.1325
1962.0 1.0 Hubel and Wiesel Ephys 200.0 600.0 https://doi.org/10.1113/jphysiol.1962.sp006837
1959.0 3.0 Amassian et al. Ephys 200.0 600.0 https://doi.org/10.1111/j.2164-0947.1959.tb01676.x
1969.0 3.0 O'Keefe and Bouma Ephys 200.0 400.0 https://doi.org/10.1016/0014-4886(69)90086-7
1967.0 9.0 Rodieck Ephys 200.0 400.0 https://doi.org/10.1152/jn.1967.30.5.1043
1965.0 2.0 Oikawa et al. Ephys 200.0 400.0 https://www.ncbi.nlm.nih.gov/pubmed/14287709
1965.0 3.0 Evarts Ephys 200.0 400.0 https://doi.org/10.1152/jn.1965.28.2.216
1964.0 10.0 Braitenberg et al. Ephys 200.0 400.0 https://doi.org/10.1007/BF00306415
1963.0 8.0 Griffith and Horn Ephys 200.0 400.0 https://doi.org/10.1038/199876a0
1961.0 1.0 Amassian et al. Ephys 200.0 400.0 https://doi.org/10.1111/j.1749-6632.1961.tb20184.x
1957.0 8.0 Baumgarten and Schaefer Ephys 200.0 400.0 https://doi.org/10.1007/BF00595651
```
#### Figure-generation source map (valid Python; not standalone plotting code)
```python
GENERATOR_PATH = "../code/run_all_figures.py"
SOURCE_FUNCTION = 'generate_neuro_recordings'
SELECTED_SOURCE_LINES = (
"info_df = info_df[info_df['calculated_information_rate'].notna()]",
"info_df = info_df[info_df['calculated_information_rate'] > 0]",
"min_year = info_df['Year'].min()",
"max_year = info_df['Year'].max()",
"info_df_display, x='Year', y='calculated_information_rate', hue='Method',",
)
```
## Reconstructing brain wiring - Connectomics
Complete connectomes at synaptic resolution currently exist only for small organisms. C. elegans has multiple whole-nervous-system reconstructions from individual specimens, with approximately ten datasets available. Adult Drosophila has fully proofread connectomes for both the male central nervous system and the female brain, with another female CNS reconstruction in progress. Larval zebrafish has had its whole brain imaged at synaptic resolution multiple times, with reconstruction and proofreading efforts ongoing. For larger organisms, progress remains at the proof-of-concept stage. In mice, the largest densely reconstructed volume is a cubic millimeter of visual cortex, containing approximately 120,000 neurons and 523 million automatically detected synapses, with ongoing proofreading of a small fraction of neurons. Current efforts funded by the NIH target 10 mm³ volumes, representing roughly 2-3% of the mouse brain. In humans, the largest synaptic-resolution volume is approximately 1 mm³ of the temporal cortex (0.00007% of the whole brain), with only 104 neurons fully proofread from approximately 16,000 identified cells. Table 2 lists the different connectomes for the organisms discussed in our report.
Electron microscopy provides the imaging foundation for nearly all existing synaptic-resolution connectomes. Over past decades technical advances include multi-beam systems that parallelize acquisition, achieving higher throughput for large volumes. However, EM workflows remain slow for mammalian-scale projects and provide minimal molecular information. Expansion microscopy is advancing rapidly on two fronts: high-expansion protocols have demonstrated effective lateral resolutions of approximately 20 nm, sufficient for dense reconstruction in mouse cortex while enabling protein-specific labels. X-ray microscopy offers another path to rapid, large-volume imaging. Synchrotron-based efforts have demonstrated cellular-resolution imaging of whole brains, and separate work has achieved the sub-40 nm resolution capable of resolving individual synapses under specialized laboratory conditions.
Figure 3 shows how the average costs per quality-controlled reconstructed neuron fell from ~\$16,500 for C. elegans in the 1980s, to ~\$214 for the Drosophila and ~\$100 for zebrafish larvae as of 2025 . Improved neuron tracing and new imaging methods like expansion microscopy could continue this trend. Larger animals, however, often have larger and more complex neurons. For rodent neurons the average price is often still about \$1,000 per neuron. To reconstruct a connectome at 1 billion dollars, prices need to fall to \$10/neuron for the mouse and \$0.01/neuron for humans. As part of this report we created a detailed model for connectomics cost-estimates interested users can consult (see data repository). Given the numerous variables involved—resolution requirements, imaging modalities, storage setups, and methodological trade-offs—we plottet data only from past or ongoing projects for Figure 3.
Irrespective of imaging modality, synaptic-resolution connectomics produces vast datasets that pose significant storage and analysis challenges. A mouse brain at 10 nm isotropic resolution would require without further lossless or lossy compression approximately 1 exabyte of storage, while a human brain would require 1-1.4 zettabytes. These volumes necessitate specialized infrastructure and advanced, AI-based compression algorithms, with recent methods demonstrating storage reductions of up to 128x. Automated reconstruction has been a second major bottleneck. The latest AI-driven methods have improved key error rates by an order of magnitude or more compared to previous approaches, dramatically reducing the need for manual correction. This brings proofreading costs down to a level comparable with image acquisition, making exhaustive reconstruction of cubic-millimeter-scale mammalian brain volumes economically feasible. Expansion microscopy has also demonstrated proof-of-concept molecular barcoding techniques that enable automated matching of neuron fragments across spatial gaps, offering an alternative route to reducing manual proofreading requirements.
The path forward for connectomics requires advances on multiple fronts. Continued improvement in AI for automated segmentation, proofreading, intelligent imaging strategies, and data compression is essential for scaling to mammalian brains. Expansion microscopy holds significant promise for scalable, molecularly-annotated connectomics by integrating its demonstrated capabilities: high-throughput imaging, dense reconstruction with high expansion factors, and molecular barcoding for automated proofreading. These technical pursuits are particularly important because ex vivo structural mapping benefits from a key advantage over in vivo functional imaging: it is not constrained by the same physical limitations. Tissue can be chemically fixed, sectioned, expanded, and imaged over arbitrarily long timescales without the constraints imposed by maintaining a living organism. This makes mammalian-scale connectomics technically challenging but not fundamentally limited in the way that whole-brain functional imaging appears to be.
Table 2 - Synaptic resolution Electron microscopy connectome reconstructions: Complete overview of connectome reconstructions in the four model organisms. Additionally, multiple expansion and x-ray experiments are ongoing. Blue: scanned. Red: Scanned and traced.
### Table 2 — Synaptic-resolution electron-microscopy connectome reconstructions
| | “Original” composite C. elegans connectome. (EM). Synaptic resolution. ( [White et al, 1986](https://royalsocietypublishing.org/doi/10.1098/rstb.1986.0056) ) | | Drosophila : One half-brain female individual. Synaptic resolution via EM
( [Scheffer et al 2020](https://elifesciences.org/articles/57443) ) |
|---|---|---|---|
| | C. elegans : 10 complete connectomes, one composite, including both sexes and five different developmental stages (EM).
( [Varshney et al., 2011](https://doi.org/10.1371/journal.pcbi.1001066) , [Cook et al., 2019](https://www.nature.com/articles/s41586-019-1352-7) , [Brittin et al., 2020](https://doi.org/10.1101/2020.05.24.112870) , [Witvliet et al., 2021](https://www.nature.com/articles/s41586-021-03778-8) ) | | Drosophila : Ventral nerve cord in female ( [Azevedo et al., 2024](https://www.nature.com/articles/s41586-024-07389-x) ) and male individuals ( [Takemura et al., 2024](https://doi.org/10.7554/eLife.97769.1) ) |
| | Zebrafish: 10% of the spinal cord in an individual before sex differentiation. Brainstem ( [Vishwanathan et al., 2024](https://www.nature.com/articles/s41593-024-01784-3) ) and spinal cord have also been reconstructed ( [Svara et al., 2018](https://www.cell.com/cell-reports/fulltext/S2211-1247(18)30756-3) ) | | Drosophila : One whole brain and one half of the central brain – in different female individuals ( [Zheng et al, 2018](https://www.cell.com/cell/fulltext/S0092-8674(18)30787-6) , [Dorkenwald et al., 2024](https://www.nature.com/articles/s41586-024-07558-y) and [Schlegel et al., 2024](https://www.nature.com/articles/s41586-024-07686-5) ).
The entire male brain and nerve cord ( [Berg et al., 2025](https://www.biorxiv.org/content/10.1101/2025.10.09.680999v2) )
Additionally, there is a complete connectome of the Drosophila larvae ( [Winding et al, 2023](https://www.science.org/doi/10.1126/science.add9330) ) |
| | Zebrafish: One whole brain in an individual before sex differentiation. ( [Svara et al., 2022](https://www.nature.com/articles/s41592-022-01621-0) ) | | Mouse: 1mm3 male mouse brain
cortex (0.2% total brain volume). Synaptic
resolution. ( [Microns, 2025](https://www.nature.com/immersive/d42859-025-00001-w/index.html) ) |
| | Additional efforts are ongoing ( [Lueckmann et al., 2025](https://arxiv.org/abs/2503.02618) ). Note: during the editing process [two](https://www.biorxiv.org/content/10.1101/2025.06.12.659365v2.abstract) [additional](https://www.biorxiv.org/content/10.1101/2025.06.10.658982v1.abstract) projects were published: | | 1 mm³ female human brain cortex (not proofread, 0.000001% total brain volume). ( [Shapson-Coe et al, 2024](https://doi.org/10.1126/science.adk4858) ) |
Figure 3 - Cost per quality-controlled reconstructed Neuron (inflation adjusted to 2025). This plot uses best estimates on the end-to-end reconstruction costs (sample preparation & slicing, scanning, reconstruction & proofreading) for the three major connectomics initiatives of the past 40 years, C. elegans, Fruitfly, Zebrafish, and the estimates from experts for current costs. ([data](https://docs.google.com/spreadsheets/d/1t1TRTNPw7iZTXHd1j7dzj0NWK91AeZu4k-VX4vDrm4U/edit?gid=1838193142#gid=1838193142) see data repository)

### Machine-readable figure record: `main-fig-03`
```yaml
id: main-fig-03
document_id: sobe-2025-main-ai
document_path: report.md
anchor: main-fig-03
canonical_url: https://brainemulation.mxschons.com/ai/report.md#main-fig-03
figure: "Cost per quality-controlled reconstructed neuron"
assets:
- "../assets/report/main-fig-03-final-pdf.png"
- "../assets/report/main-fig-03-export.png"
data_status: publication_raster_with_contextual_current_sources
data_sources:
- "../data/current-repository/costs/neuron-reconstruction-estimates.tsv"
generator: ../code/run_all_figures.py
generator_function: generate_cost_per_neuron
publication_export_members:
- "images/image36.png"
canonical_pdf_pages:
- 19
note: "The final PDF's six points and three cost thresholds are primary. The secondary export raster has five points and two thresholds. The inline block contains the six final-PDF points; the source file also contains later projections."
```
#### Inline contextual data (not an exact publication input): six displayed cost estimates
```tsv
Type Organism Year Neurons Approximate inflation adjusted order of magnitude total costs for scanning and tracing ($) Reconstructed Neurons / 1 Million $ Cost / Neuron Reference
Estimate C. elegans (White et al 1986) 1986 302 $5,000,000 60 $16,556 Estimate: 4 FTEs at $20k / year for 10 years with 50% institutional overhead and $250k in EM costs = $1.45M
Budget Fruitfly Zheng et al, 2018 none none (Murthy, Seung, et al., 2024) 2018 140000 $30,000,000 4,667 $214 Estimate based on conversations with experts and authors.
Budget Zebrafish (Svara et al., 2022) 2021 100000 $10,000,000 10,000 $100 Conversation with authors
Estimate Mouse, BRAIN CONNECTS 10 mm^3 none none (NIH, 2024) 2024 1500000 $43,000,000 45,455 $29 BRAIN Connects Initiative funding
Estimate Mouse, Wellcome Trust Report Estimate (10nm isotropic) 2023 70000000 2,121,212 $306.95 from here
Estimate Mouse, 15nm isotropic with current proofreading (EM) 2025 70000000 2,121,212 $92 from here
```
#### Figure-generation source map (valid Python; not standalone plotting code)
```python
GENERATOR_PATH = "../code/run_all_figures.py"
SOURCE_FUNCTION = 'generate_cost_per_neuron'
SELECTED_SOURCE_LINES = (
"df['CostPerNeuron'] = df['Cost / Neuron'].replace('[\\\\$,]', '', regex=True).astype(float)",
"row['Year'], row['CostPerNeuron'],",
"point_data.append((row['Year'], row['CostPerNeuron'], label))",
"ax.set_xlabel('Year')",
)
```
## Modelling brains faithfully - Computational Neuroscience
Meaningful progress toward whole-brain emulation is currently confined to small organisms where comprehensive datasets are becoming available. In C. elegans, multi-scale, closed-loop simulations now reproduce basic behaviors by integrating neural dynamics, body mechanics, and environmental interaction. For Drosophila, the adult connectome has enabled models spanning the entire brain, successfully predicting neural responses and circuit functions for behaviors like feeding and grooming. Larval zebrafish modeling, while often circuit-specific, is driven by readily available whole-brain functional data, with proof-of-concept connectome-constrained simulations demonstrating accurate prediction of oculomotor integration dynamics, and embodied models replicating optomotor responses. With a full connectome for this organism expected soon, the field is poised for more integrated structural-functional models. In larger organisms like mice and humans, however, comprehensive emulation remains at the proof-of-concept stage. These efforts demonstrate building biophysically detailed cortical circuits by algorithmically inferring connectivity, or running human-scale simulations on supercomputers as feasibility tests.
As part of this report, simulation attempts for different organisms were rated on the following 0-3 point scale across 10 dimensions. No simulation attempt scores highly across all dimensions, and some cannot be found in any simulation attempt at all. Figure 4 shows a respective heatmap plot across the dimensions we introduce in detail in the Definition chapter.
Two fundamental challenges constrain progress at larger scales. First and foremost is data scarcity: fitting the vast number of parameters required for accurate neural models (a single biophysically detailed neuron can require tens of thousands of parameters) requires dense, high-quality functional and structural datasets. While large neural data repositories exist, lack of standardization and variable data quality often limit their usability for parameter fitting. Moreover, in larger organisms, comprehensive whole-brain recordings remain infeasible, further compounding this challenge.
Second, computational demands are substantial. Even with simplified neuron and synapse models, real-time mammalian-scale simulation strains available resources. Assuming approximately 10 KB memory and 1 MFLOP/s per neuron with synapses, a mouse brain simulation requires 1-2 TB memory and 5-10 PFLOP/s; a human brain simulation requires 1-3 PB memory and approximately 10 EFLOP/s. For comparison, an H100 GPU (80 GB, 67 TFLOP/s) can store roughly 8 million neurons before hitting memory limits; devices in the 1980s (~0.5 GB, 2 GFLOP/s) could handle only about 2,000 neurons (see Figure 5). While hardware will continue to improve, it cannot compensate for insufficient training data; data constraints set a hard upper bound on model quality.
The path forward involves three coordinated strategic objectives. First, achieve high-fidelity emulations in small, tractable organisms by fully integrating complete connectomes with rich, whole-brain functional and causal perturbation datasets. Activity prediction benchmarks in C. elegans and larval zebrafish already demonstrate that model performance improves with increased data availability, suggesting a productive feedback loop, as benchmark results can guide experimentalists on what types of data (passive recordings, targeted perturbations, molecular annotations) and in what quantities would most improve computational models. Second, within these same systems, develop and validate generative models that can compensate for the lack of whole-brain activity data, for instance by inferring functional parameters from anatomical data alone, mapping molecularly-annotated structure to function. For mammalian nervous systems, such structure-to-function mappings will likely be indispensable. Third, in parallel, optimize simulation software (leveraging modern accelerators and event-driven paradigms) and develop specialized hardware to reduce computational and memory requirements for mammalian-scale emulations.
Figure 4 - Heatmap plot of computational brain models across different organisms. The figure plots the score of a brain model across various dimensions. All papers referenced in the report and other noteworthy papers are listed. ([data](https://docs.google.com/spreadsheets/d/1aDvTOqtT14_wooOXhPY5mnc3-lqghmZFHtauJCaSNgU/edit?gid=0#gid=0))

### Machine-readable figure record: `main-fig-04`
```yaml
id: main-fig-04
document_id: sobe-2025-main-ai
document_path: report.md
anchor: main-fig-04
canonical_url: https://brainemulation.mxschons.com/ai/report.md#main-fig-04
figure: "Computational brain-model capabilities heatmap"
assets:
- "../assets/report/main-fig-04-final-pdf.png"
- "../assets/report/main-fig-04-export.png"
data_status: publication_raster_with_contextual_current_sources
data_sources:
- "../data/current-repository/simulations/computational-models.tsv"
generator: ../code/run_all_figures.py
generator_function: generate_sim_heatmap
publication_export_members:
- "images/image44.png"
canonical_pdf_pages:
- 21
note: "The final PDF heatmap is primary; the larger final-circulation export roster is retained as a secondary asset. The canonical script repository currently has uncommitted dataset changes, so inline rows are contextual."
```
#### Inline contextual data (not an exact publication input): model capability matrix
```tsv
First Author Year Organism Connectivity accuracy Percentage of neurons Neurontypes Plasticity Functional Accuracy Neuromodulation Temporal resolution Behavior Personality-defining Characteristics Learning Link
Gertler et al. 2008 Mouse 0 0 2 0 3 1 2 0 0 0 https://doi.org/10.1523/JNEUROSCI.2660-08.2008
Anonymous 2024 Zebrafish 0 2 0 0 1 0 1 0 0 0 https://openreview.net/forum?id=oCHsDpyawq
Wang 2023 Mouse 1 1 0 0 1 0 1 0 0 0 https://www.biorxiv.org/content/10.1101/2023.03.21.533548v1
Huang 2019 Drosophila 2 1 2 1 2 0 2 0 0 0 https://doi.org/10.3389/fninf.2018.00099
Higuchi 2022 Drosophila 2 1 2 2 3 1 2 1 0 1 https://doi.org/10.1101/2022.11.01.512969
Verhulst et al. 2018 Human 1 1 1 1 1 0 2 0 0 1 https://www.sciencedirect.com/science/article/pii/S0378595517303477?via%3Dihub
Yamazaki et al. 2021 Human 1 2 2 0 2 0 2 0 0 0 https://doi.org/10.1016/j.neuroscience.2021.01.014
Rodarie 2022 Mouse 2 1 2 1 2 0 2 1 0 0 https://infoscience.epfl.ch/record/297317
Billeh 2020 Mouse 2 1 2 0 3 0 2 1 0 0 https://www.cell.com/neuron/fulltext/S0896-6273(20)30067-2?_returnURL=https%3A%2F%2Flinkinghub.elsevier.com%2Fretrieve%2Fpii%2FS0896627320300672%3Fshowall%3Dtrue
Liu 2024 Zebrafish 2 1 2 0 1 0 2 2 0 0 https://doi.org/10.1101/2024.12.19.629427
Lu 2024 Human 1 2 1 0 2 0 2 1 0 0 https://doi.org/10.1038/s43588-024-00731-3
Cowley 2024 Drosophila 2 0 2 0 1 0 1 2 0 0 https://www.nature.com/articles/s41586-024-07451-8
Gambosi et al. 2024 Mouse 2 1 2 2 2 1 2 2 0 1 https://www.worldscientific.com/doi/10.1142/S012906572450045X
Kim et al. 2019 C. elegans 3 2 2 0 1 0 2 1 0 0 https://www.frontiersin.org/journals/computational-neuroscience/articles/10.3389/fncom.2019.00008/full
Simeon et al. 2024 C. elegans 3 3 0 0 1 0 1 0 0 0 https://www.biorxiv.org/content/biorxiv/early/2024/03/06/2024.02.13.580186.full.pdf
Sarma 2018 C. elegans 3 3 3 0 3 1 2 2 0 0 https://pubmed.ncbi.nlm.nih.gov/30201845/
Lappalainen et al. 2024 Drosophila 3 1 2 0 1 0 1 1 0 0 https://www.nature.com/articles/s41586-024-07939-3
Shiu et al. 2024 Drosophila 3 2 1 0 2 0 2 1 0 0 https://www.nature.com/articles/s41586-024-07763-9
Zhao 2024 C. elegans 3 1 3 0 3 0 2 2 0 0 https://www.nature.com/articles/s43588-024-00738-w
Pronold 2024 Human 1 1 1 0 2 0 2 0 0 0 https://academic.oup.com/cercor/article/34/10/bhae409/7826014
Schepper et al. 2022 Mouse 2 0 2 2 3 0 2 2 0 0 https://www.nature.com/articles/s42003-022-04213-y
Jiang 2024 Mouse 2 0 2 1 2 0 2 1 0 0 https://academic.oup.com/cercor/article/34/9/bhae378/7779257
Vishwanathan 2024 Zebrafish 3 1 2 0 1 0 1 2 0 0 https://www.nature.com/articles/s41593-024-01784-3
Izhikevich and Edelman 2008 Human 1 1 1 0 0 0 0 https://doi.org/10.1073/pnas.0712231105
```
#### Figure-generation source map (valid Python; not standalone plotting code)
```python
GENERATOR_PATH = "../code/run_all_figures.py"
SOURCE_FUNCTION = 'generate_sim_heatmap'
SELECTED_SOURCE_LINES = (
'def generate_sim_heatmap():',
'logger.info(f" Found {len(neuro_sim_df)} valid entries for heatmap")',
'heatmap_data = neuro_sim_df[data_columns].astype(float)',
'# Create figure with subplots: organism labels | heatmap',
'# Create grid: organism bar (narrow) | heatmap (wide)',
'heatmap_filled = heatmap_data.fillna(-1)',
'heatmap = sns.heatmap(',
'heatmap_filled,',
'cbar = heatmap.collections[0].colorbar',
'# Add author labels on right side of heatmap',
'org_ax.set_ylim(len(neuro_sim_df), 0) # Inverted to match heatmap',
"save_figure(fig, 'neural-simulation-capabilities-heatmap', attribution_position='axes')",
)
```
Figure 5 - Computational demands across organisms: This figure illustrates the computational demands across compute and storage for various organisms and compares current state-of-the-art hardware against it. It uses point neurons and 5-compartment neurons estimates. For mice, a neuron is between 0.3 to 4 million FLOP/s and 15-30KB. This totals around 0.1 PetaFLOP/s and 1-2 TB of memory. Single GPUs like the Blackwell Ultra can calculate this fast, but as of today, they max out at 288 GB memory. Interconnect speeds depend on many setup variables and accurate connectomes, which is why the figure does not include estimates.([data](https://docs.google.com/spreadsheets/d/1_etVPtLgtjIYBG_jC5gtwr7bGcjHKiZzCqpgw4x_N2o/edit?gid=703689354#gid=703689354))

### Machine-readable figure record: `main-fig-05`
```yaml
id: main-fig-05
document_id: sobe-2025-main-ai
document_path: report.md
anchor: main-fig-05
canonical_url: https://brainemulation.mxschons.com/ai/report.md#main-fig-05
figure: "Computational demands across organisms"
assets:
- "../assets/report/main-fig-05-final-pdf.png"
- "../assets/report/main-fig-05-export.png"
data_status: publication_raster_with_contextual_current_sources
data_sources:
- "../data/current-repository/compute/computational-demands-organisms.tsv"
- "../data/current-repository/compute/hardware-characteristics.tsv"
generator: ../code/run_all_figures.py
generator_function: generate_compute_storage_parallel
publication_export_members:
- "images/image26.png"
canonical_pdf_pages:
- 22
note: "The final PDF panel with the interconnect bottleneck annotation is primary; the final-circulation export raster is retained as a secondary asset."
```
#### Inline contextual data (not an exact publication input): organism requirements
```tsv
organisms C. elegans (body) fly (brain) mouse (cortex) mouse (brain) human (cortex) human (brain) Unnamed: 7 Unnamed: 8 neuron models LIF 5-comp HH Unnamed: 12 synapse models alpha synapse tsodyks-markram ref_id supporting_refs ref_note confidence validated_by
neurons 3.02E+02 1.40E+05 1.37E+07 7.00E+07 2.00E+10 8.60E+10 FLOPS per sec of sim 40000.0 3.45E+06 FLOPS per sec of sim 50000.0 80000.0 none none
synapses 2.06E+04 5.40E+07 1.20E+11 1.35E+11 1.50E+14 1.70E+14 FLOPS per spike 15.0 - FLOPS per event 20.0 51.0 none none
firing (Hz) 10 10 10 10 10 10 bytes 4.0 8.00E+01 bytes 8.0 16.0 none none
spikes/s 3.02E+03 1.40E+06 1.37E+08 7.00E+08 2.00E+11 8.60E+11 none none
fan-in 6.82E+01 3.86E+02 8.76E+03 1.93E+03 7.50E+03 1.98E+03 none none
events/s 2.06E+05 5.40E+08 1.20E+12 1.35E+12 1.50E+15 1.70E+15 none none
timesteps/s 1.00E+04 1.00E+04 1.00E+04 1.00E+04 1.00E+04 1.00E+04 none none
time-based simulation cost (per sec) C. elegans (body) fly (brain) mouse (cortex) mouse (brain) human (cortex) human (brain) none none
FLOPS per sec of sim (lower bound) 1.04E+09 2.71E+12 6.00E+15 6.75E+15 7.50E+18 8.50E+18 none none
FLOPS per sec of sim (upper bound) 2.69E+09 4.80E+12 9.65E+15 1.10E+16 1.21E+19 1.39E+19 none none
event-driven simulation cost (per sec) C. elegans (body) fly (brain) mouse (cortex) mouse (brain) human (cortex) human (brain) none none
FLOPS per sec of sim (lower bound) 4.16E+06 1.08E+10 2.40E+13 2.70E+13 3.00E+16 3.40E+16 none none
FLOPS per sec of sim (upper bound) 1.05E+09 5.11E+11 1.08E+14 3.10E+14 1.46E+17 8.67E+16 none none
simulation storage requirements C. elegans (body) fly (brain) mouse (cortex) mouse (brain) human (cortex) human (brain) none none
bytes (lower bound) 1.66E+05 4.33E+08 9.60E+11 1.08E+12 1.20E+15 1.36E+15 none none
bytes (upper bound) 3.54E+05 8.75E+08 1.92E+12 2.17E+12 2.40E+15 2.73E+15 none none
```
#### Inline contextual data (not an exact publication input): hardware characteristics
```tsv
System Year FP16_TFLOPs_Dense Memory_GB Interconnect_GB/s Price_USD description References
MacBook Pro 2024 M4 Pro 2024 7.4 48.0 270.0 $2,499 Apple M4 Pro laptop, unified memory https://www.apple.com/macbook-pro/specs/ https://www.cpu-monkey.com/en/igpu-apple_m4_pro_16_core
Mac Studio M2 Ultra 2023 27.0 190.0 800.0 $3,999 Apple M2 Ultra workstation https://www.apple.com/shop/buy-mac/mac-studio/ https://www.cpu-monkey.com/en/igpu-apple_m2_ultra_76_core
NVIDIA A100 SXM 80GB 2020 310.0 80.0 600.0 $15,000 Single GPU, Tensor Core FP16 dense https://www.nvidia.com/content/dam/en-zz/Solutions/Data-Center/a100/pdf/nvidia-a100-datasheet-nvidia-us-2188504-web.pdf
NVIDIA H100 NVL 2023 840.0 94.0 900.0 $25,000 2-GPU pair, NVLink, Tensor Core FP16 https://www.pny.com/file%20library/company/support/product%20brochures/nvidia%20data%20center%20gpus/english/h100-nvl-datasheet.pdf
NVIDIA DGX GH200 2023 250000.0 140000.0 120000.0 $500,000 Supercomputer node, 256 Grace Hopper https://developer.nvidia.com/blog/announcing-nvidia-dgx-gh200-first-100-terabyte-gpu-memory-system/
NVIDIA HGX B200 2024 18000.0 1400.0 14000.0 $350,000 8x Blackwell GPUs, NVLink 5.0 https://lenovopress.lenovo.com/lp2226-thinksystem-nvidia-b200-180gb-1000w-gpu
NVIDIA Tesla C870 2007 0.35 1.5 $1,500 Historical reference GPU https://www.techpowerup.com/gpu-specs/tesla-c870.c1542
```
#### Figure-generation source map (valid Python; not standalone plotting code)
```python
GENERATOR_PATH = "../code/run_all_figures.py"
SOURCE_FUNCTION = 'generate_compute_storage_parallel'
SELECTED_SOURCE_LINES = (
'hardware_df = pd.read_csv(DATA_FILES["compute_hardware"], sep=\'\\t\')',
'demands_df = pd.read_csv(DATA_FILES["computational_demands"], sep=\'\\t\')',
)
```